
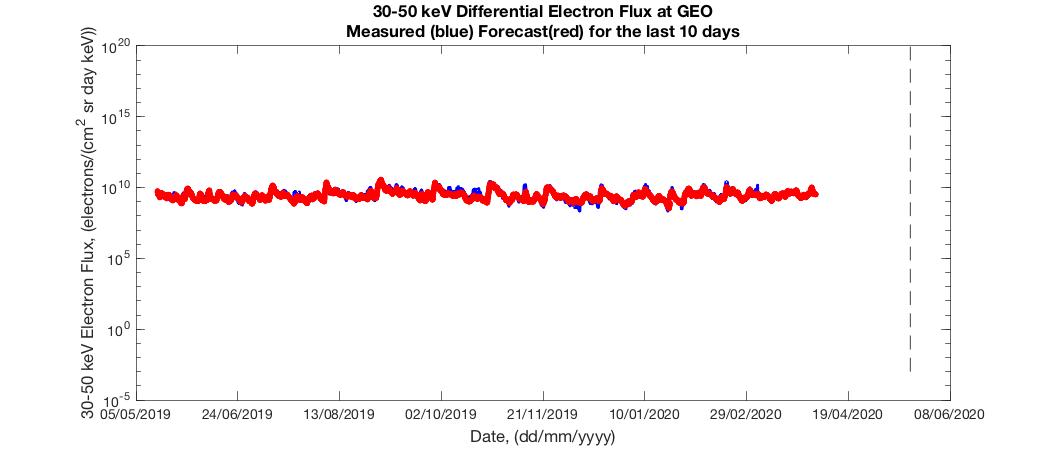
Real time forecast of the 30-50 keV electron flux at geosynchronous orbit using SWIFT inputs
Forecast Figures
Select Figure
Past 10 Days
Data of the past years model predicted output in a tabular format.
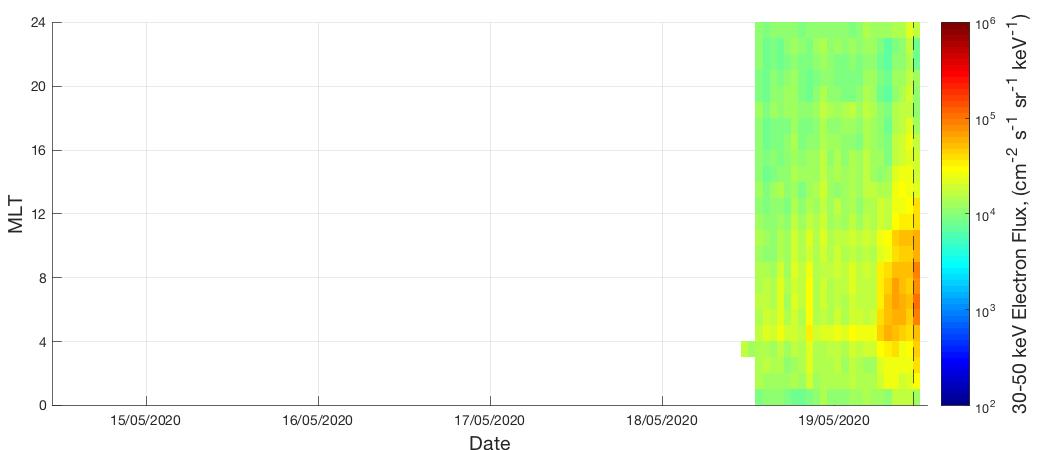
MLT Forecast Figures
3 Day Forecast
MLT-Time plot
Data of the past years model predicted output in a tabular format.
Real time forecast of the 50-100 keV electron flux at geosynchronous orbit using SWIFT inputs
Forecast Figures
Select Figure
Past 10 Days

Data of the past years model predicted output in a tabular format.
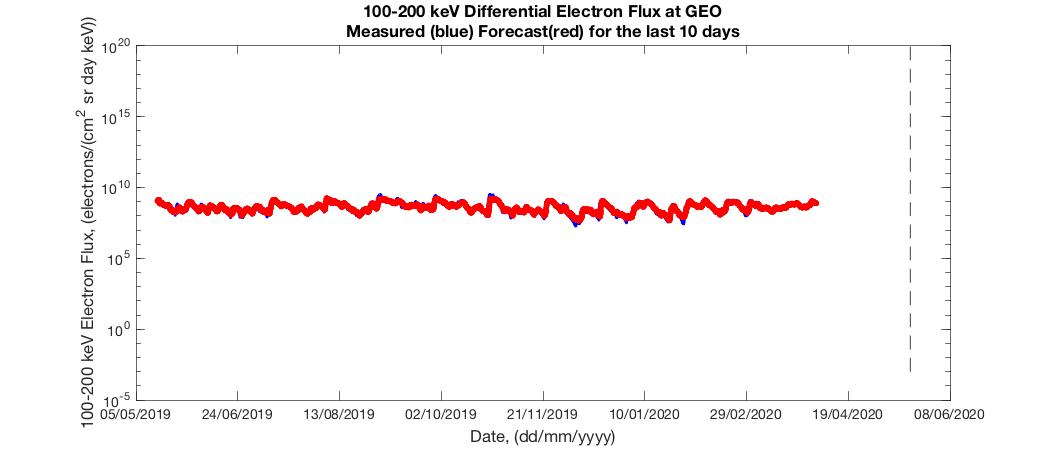
Real time forecast of the 100-200 keV electron flux at geosynchronous orbit using SWIFT inputs
Forecast Figures
Select Figure
Past 10 Days
Data of the past years model predicted output in a tabular format.
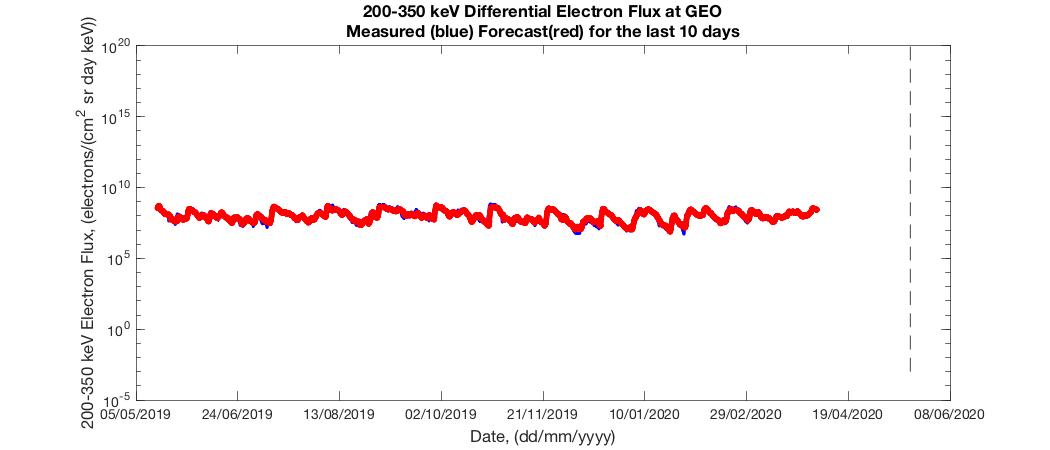
Real time forecast of the 200-350 keV electron flux at geosynchronous orbit using SWIFT inputs
Forecast Figures
Select Figure
Past 10 Days
Data of the past years model predicted output in a tabular format.
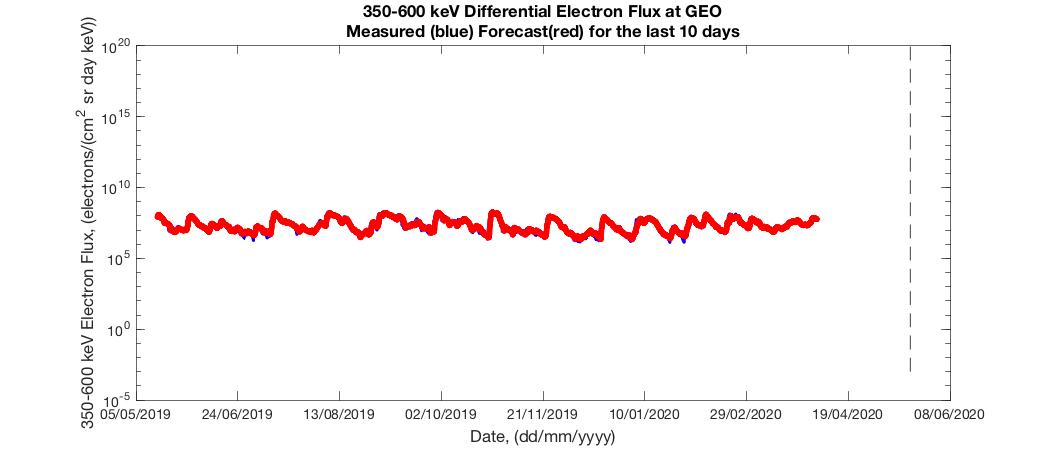
Real time forecast of the 350-600 keV electron flux at geosynchronous orbit using SWIFT inputs
Forecast Figures
Select Figure
Past 10 Days
Data of the past years model predicted output in a tabular format.
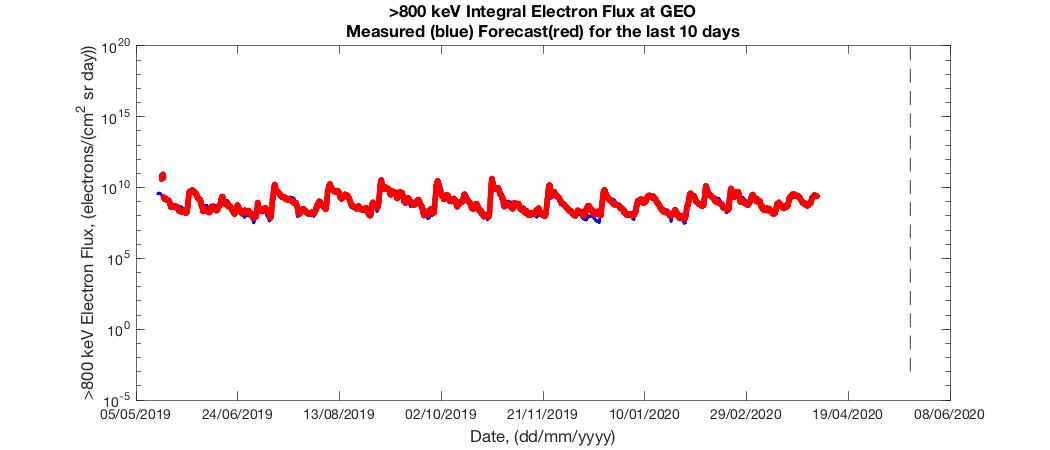
Real time forecast of the >800 keV electron flux at geosynchronous orbit using SWIFT inputs
Forecast Figures
Select Figure
Past 10 Days
Data of the past years model predicted output in a tabular format.
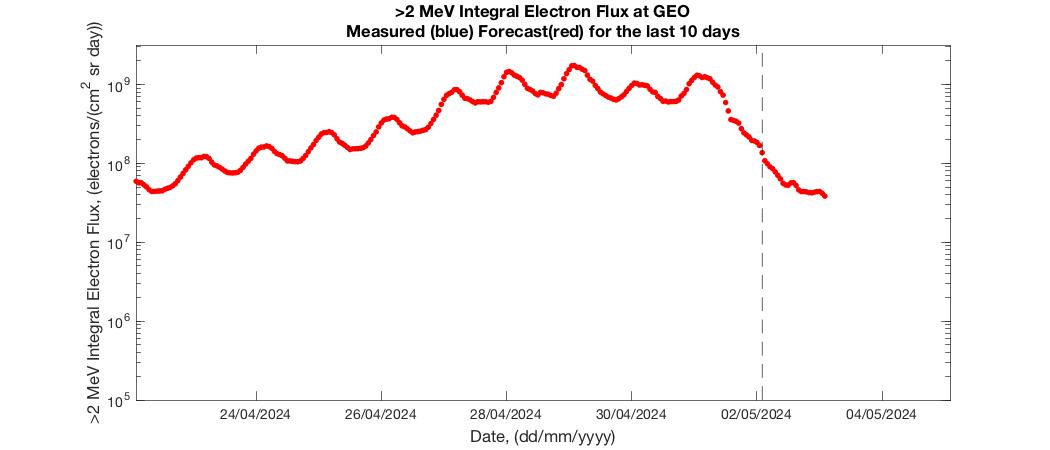
Real time forecast of the >2 MeV electron flux at geosynchronous orbit using SWIFT inputs
Forecast Figures
Select Figure
Past 10 Days
Data of the past years model predicted output in a tabular format.
About These Model
A Multi Input Single Output (MISO) NARMAX model is used to provide a two day ahead forecast of the electron flux. The inputs to the model are the daily averaged solar wind parameters. It should be noted that the two day ahead forecast will change as more data is obtained for the current day.
SWIFT solar wind predictions, provided by Warwick, are used to compute the model output (red), which is compared to the measured electron flux (blue).
The electron flux value at a specific time is the average of the past day. For example, an electron flux value recorded at 10:00:00 UTC 04.05.2012 is the average electron flux between 10:01:00 UTC 03.05.2012 and 10:00:00 UTC 04.05.2012.
Data gaps in the solar wind data are indicated by missing points in the figures.
For more detail on the development of these models see Boynton et al,. [2015] and Boynton et al,. [2016].
These models were developed thanks to funding from the European Union's Horizon 2020 research and innovation programme under grant agreement No. 637302 called PROGRESS